Posts

Showing posts with the label Statistics: Metro Denver Sales

Southeast Denver Home Sale Statistics 2004 to 2008

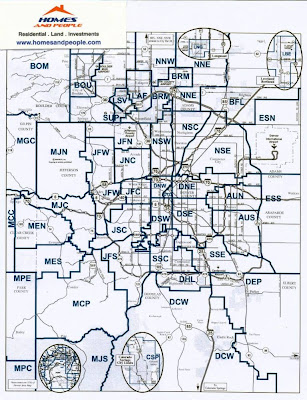
2004 was a record year in terms of number of home sales in Colorado. So how do we compare in 2008? The Data included is for southeast metro Denver including: Aurora South (AUS), Douglas County West (DCW), Douglas / Highlands Ranch / Lone Tree (DHL), Dougls / Elbert / Parker (DEP), Denver Southeast (DSE), East Suburban South (ESS), South Suburban Central (SSC), South Suburban East (SSE). Click here for an MLS area map 2004 2006 2007 2008 Total Inventory 7,397 7,925 7,944 8,363 Sales YTD 4,871 4,849 4,750 4,104 Sold Price 326,615 376,654 376,298 346,061 % of List Price 98% 98% 98% 97% Avg Days on the Market 88 95 112 109 Based on information from Metrolist. Homes and People does not guarantee nor is in anyway responsible for its accuracy. Data maintained by Metrolist (Denver MLS) may not reflect all real estate activity in the market.
Northeast Denver Home Sale Statistics 2004 to 2008

2004 was a record year in terms of number of home sales in Colorado. So how do we compare in 2008? The Data included is for northeast metro Denver including: Aurora North (AUN), Brighton and Fort Lupton (BFL), Denver Northeast (DNE), East Suburban North (ESN), North Northeast Suburban (NNE), North Suburban Central (NSC), North Suburban East (NSE). Click here for an MLS area map 2004 2006 2007 2008 Total Inventory 4,031 5,079 4,949 4,380 Sales YTD 2,239 2,303 2,598 2,757 Sold Price 205,208 211,041 205,953 181,132 % of List Price 100% 99% 98% 97% Average Days on the Market 89 107 120 104 Based on information from Metrolist. Homes and People does not guarantee nor is in anyway responsible for its accuracy. Data maintained by Metrolist (Denver MLS) may not reflect all real estate activity in the market.

Southwest Denver Home Sale Statistics 2004 to 2008

2004 was a record year in terms of number of home sales in Colorado. So how do we compare in 2008? The Data included is for southwest metro Denver including: Denver South West (DSW), Jefferson County South (JFS), Jefferson County South (JSC), Mountain Clear Creek (MCC), Mountain Conifer Pine (MCP), Mountain Evergreen South (MES), Mountain evergreen North (MEN), Mountain Jefferson County (MJC), Mountain Jefferson Sounth (MJS), Mountain Park County (MPC), Mountain Park East (MPE). Click here for an MLS area map 2004 2006 2007 2008 Total Inventory 3,320 3,412 3,090 3,101 Sales YTD 1,879 1,804 1,861 1,676 Sold Price 267,870 289,505 274,626 250,060 % of List Price 98% 98% 97% 97% Avg Days on the Market 88 110 128 111 Based on information from Metrolist. Homes and People does not guarantee nor is in anyway responsible for its accuracy. Data maintained by Metrolist (Denver MLS) may not reflect all real estate activity in the market.

Northwest Denver Home Sale Statistics 2004 to 2008

2004 was a record year in terms of number of home sales in Colorado. So how do we compare in 2008? The Data included is for northwest metro Denver including: Broomfield (BRM), Denver North West (DNW), Downtown Denver (DTD), Jefferson County Central (JFC), Jefferson County West (JFW), Jefferson County North Central (JFN), Lafayette (LAF), Louisville (LSV), Mountain Gilpin County (MGC), Mountain Jefferson North (MJN), North Suburban West (NSW), and Superior (SUP). Click here for an MLS area map 2004 2006 2007 2008 Total Inventory 3,781 3,722 3,447 3,114 Sales YTD 2,375 2,185 2,266 2,015 Sold Price 262,366 276,191 274,713 261,451 % of List Price 98% 98% 98% 98% Average Days on the Market 85 98 110 108 Based on information from Metrolist. Homes and People does not guarantee nor is in anyway responsible for its accuracy. Data maintained by Metrolist (Denver MLS) may not reflect all real estate activity in the market.

Metro Denver MLS MAP

Image
Click on the picture to enlarge

Absorption Rate Definition

The rate at which a market can absorb additional units of supply without causing market saturation and severe price distortions. For example, during a recessionary period, many homeowners may list their house for sale. Since the supply of homes entering the home resale market increased without a corresponding increase in demand, the market absorption rate has been exceeded, and the market price of the resale homes declines. A simple definition is the number of months it takes to sell the current inventory at the present rate of sales.

MLS Home Search

http://recolorado.com/