Northeast Denver Home Sale Statistics 2004 to 2008
2004 was a record year in terms of number of home sales in Colorado. So how do we compare in 2008?
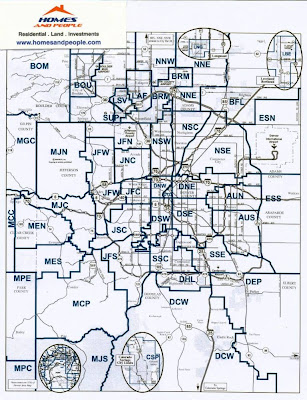
The Data included is for northeast metro Denver including: Aurora North (AUN), Brighton and Fort Lupton (BFL), Denver Northeast (DNE), East Suburban North (ESN), North Northeast Suburban (NNE), North Suburban Central (NSC), North Suburban East (NSE). Click here for an MLS area map
2004 | 2006 | 2007 | 2008 | |
Total Inventory | 4,031 | 5,079 | 4,949 | 4,380 |
Sales YTD | 2,239 | 2,303 | 2,598 | 2,757 |
Sold Price | 205,208 | 211,041 | 205,953 | 181,132 |
% of List Price | 100% | 99% | 98% | 97% |
Average Days on the Market | 89 | 107 | 120 | 104 |
Based on information from Metrolist. Homes and People does not guarantee nor is in anyway responsible for its accuracy. Data maintained by Metrolist (Denver MLS) may not reflect all real estate activity in the market.


Comments